


Facebook advertising is a go-to marketing channel when you want to raise brand awareness, connect with prospects, and get new customers. But how do you know you’re maximizing your Facebook ads ROI? Our data in this Facebook benchmarks report has the answer!
In partnership with our friends at WordStream by LocaliQ, we’re sharing Facebook ads benchmarks across 20 industries to help you better understand how your Facebook ads performance compares to averages in your industry. The report includes Facebook ads benchmarks for click-through rate, cost per click, and more.
💡 Want to take this data to go (+get key trends and even more insights)? Download our free Facebook ads benchmarks guide here!
Contents
- Facebook ads benchmarks: Traffic campaigns
- Facebook ads benchmarks: Lead gen campaigns
- Facebook ads tips
Facebook ads benchmarks: Traffic campaigns
Facebook advertising optimizes your campaigns against an ad objective. Your chosen ad objective for each campaign helps Facebook know how to best serve your ads to reach specific goals.
When you want to drive clicks from your Facebook ads to your landing page, app, or event, you’d use the traffic objective. Many small businesses favor traffic campaigns since they increase the chances of getting more website visitors, and more importantly, potential customers!
Note: Because this campaign objective focuses on driving traffic, it often results in higher cost per lead and conversion rates. Concentrating on the most relevant metrics for your advertising objective is essential, which is why we’ve left out those particular metrics.
Average click-through rate
CTR, or click-through rate, measures how frequently users click on your ad. CTR is a good indicator of how click-worthy your ad is and can help you determine the quality of your Facebook ad content.
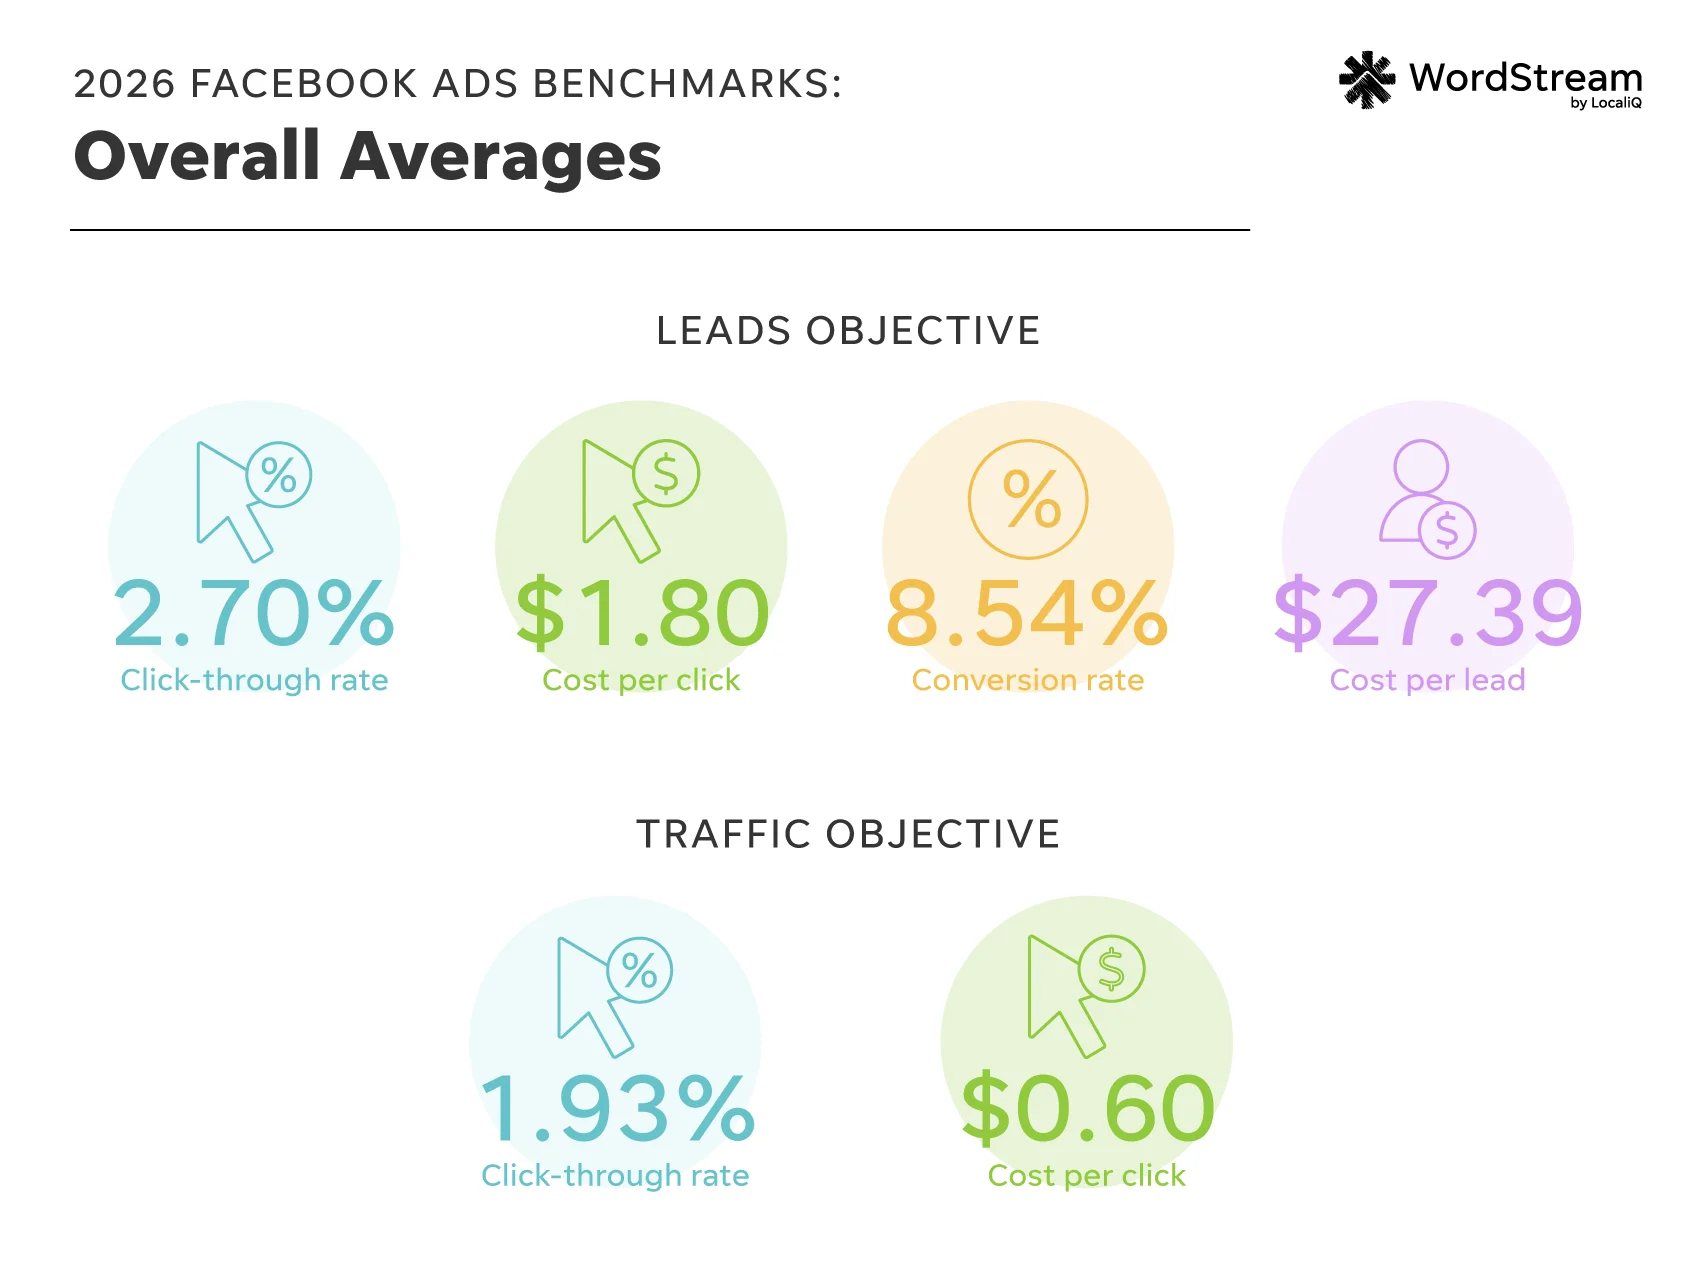
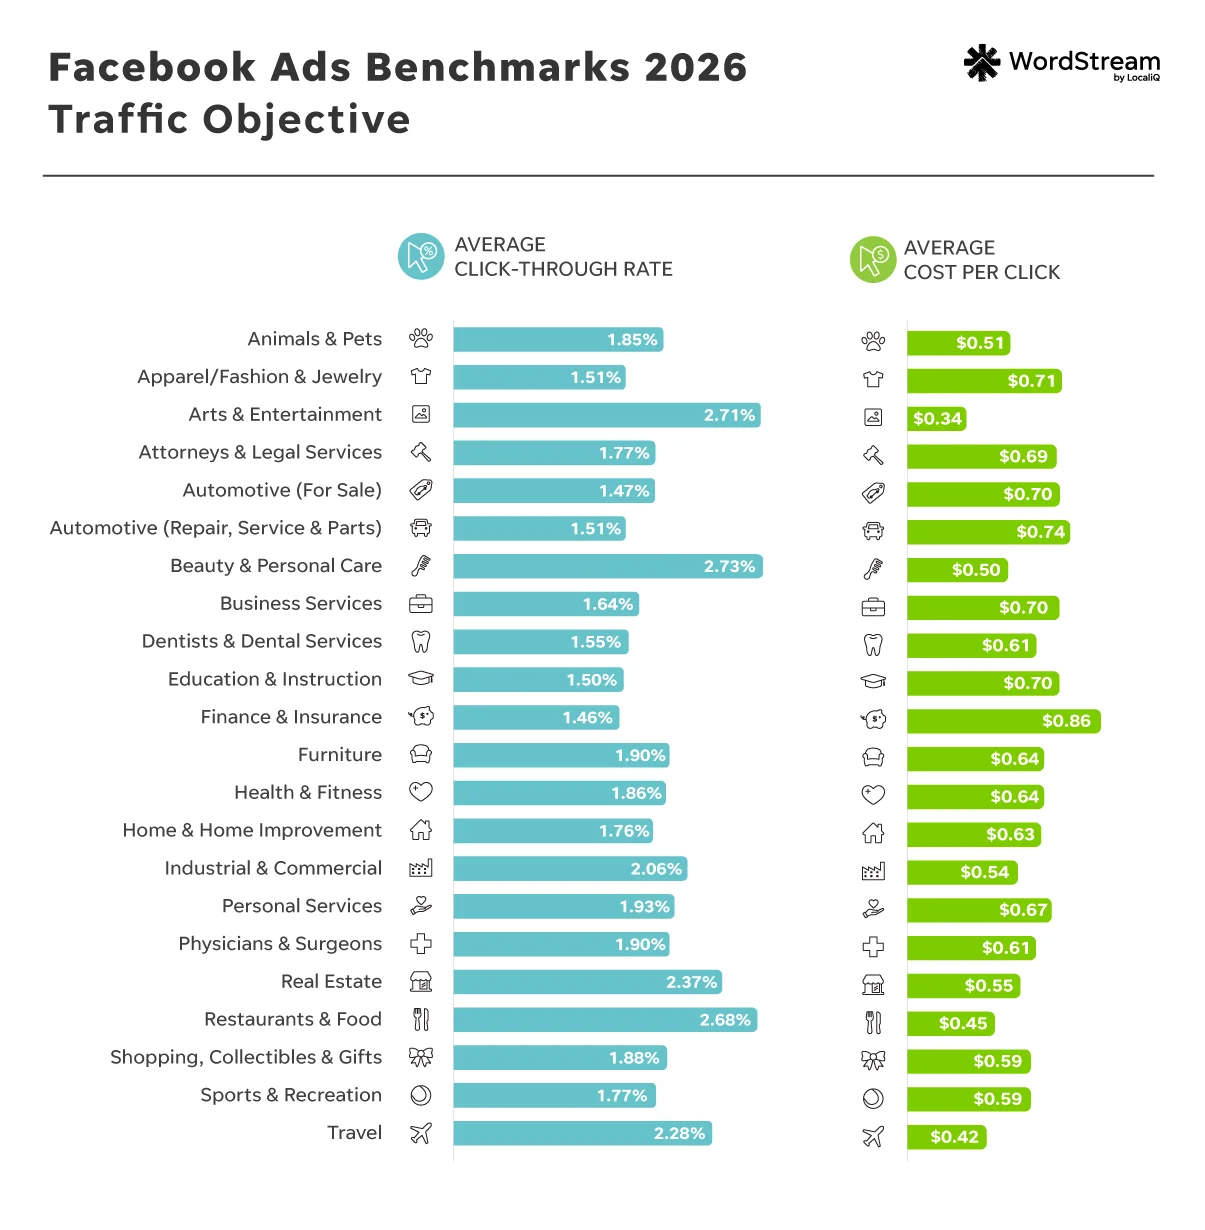
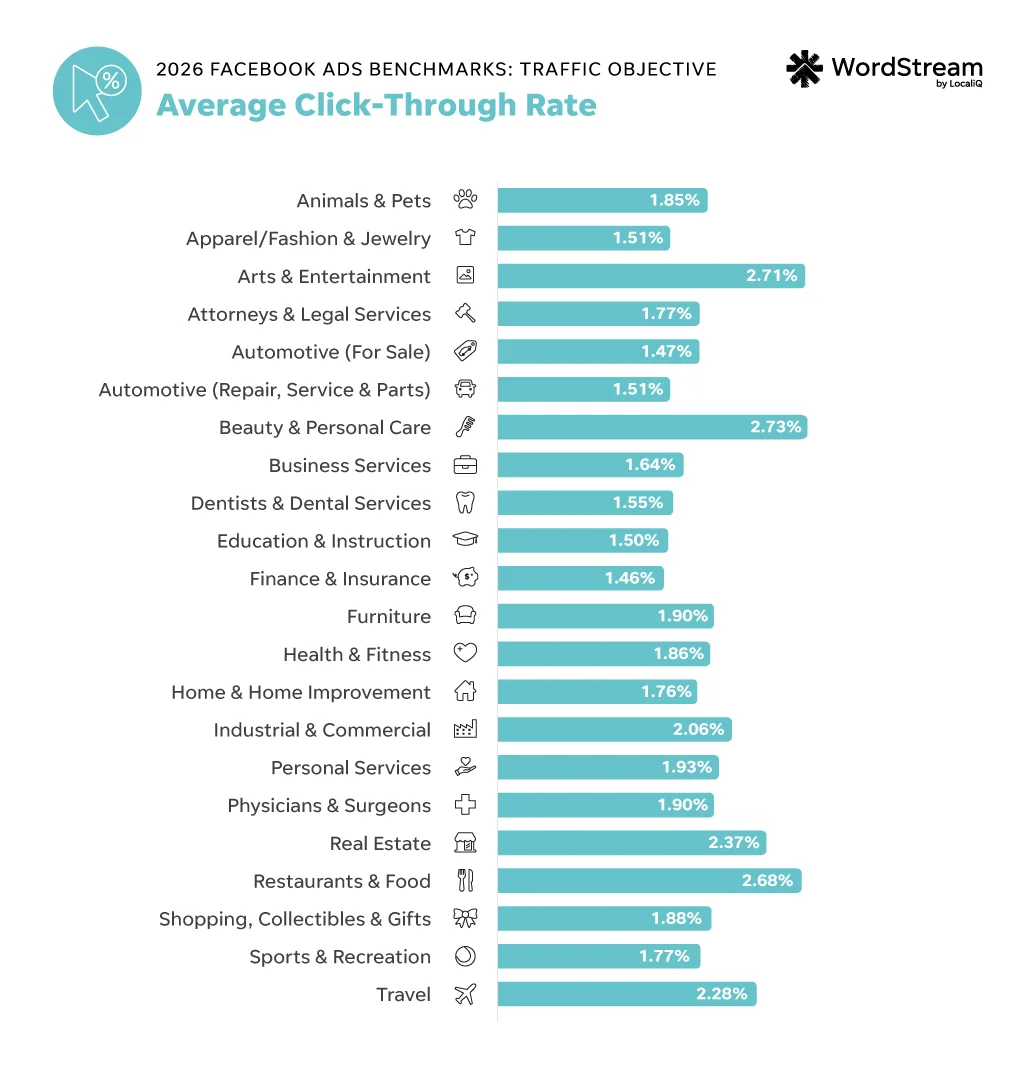
The average click-through rate in Facebook ads for traffic campaigns across all industries is 1.93%, which is up from last year’s overall average of 1.71%.
| Business category | Average CTR |
| Animals & Pets | 1.85% |
| Apparel / Fashion & Jewelry | 1.51% |
| Arts & Entertainment | 2.71% |
| Attorneys & Legal Services | 1.77% |
| Automotive–For Sale | 1.47% |
| Automotive–Repair, Service & Parts | 1.51% |
| Beauty & Personal Care | 2.73% |
| Business Services | 1.64% |
| Dentists & Dental Services | 1.55% |
| Education & Instruction | 1.50% |
| Finance & Insurance | 1.46% |
| Furniture | 1.90% |
| Health & Fitness | 1.86% |
| Home & Home Improvement | 1.76% |
| Industrial & Commercial | 2.06% |
| Personal Services | 1.93% |
| Physicians & Surgeons | 1.90% |
| Real Estate | 2.37% |
| Restaurants & Food | 2.68% |
| Shopping, Collectibles & Gifts | 1.88% |
| Sports & Recreation | 1.77% |
| Travel | 2.28% |
The industries with the highest CTRs were Beauty & Personal Care at 2.73%, Arts & Entertainment at 2.71%, and Restaurants & Food at 2.68%.
The industries with lower average CTRs were Finance & Insurance at 1.46%, Automotive—For Sale at 1.47%, and Education & Instruction at 1.50%.
Since Facebook ads are so visually driven, it makes sense that industries that can offer more creative ads tend to see higher click-through rates. For example, Beauty & Personal Care and Restaurants & Food are typically industries that offer “anytime treats.” Meaning that people don’t need to be in the market to respond to these types of ads, since shopping or dining can be tempting at any time.
In contrast, industries like Automotive—For Sale, Education, and Insurance can’t always rely on compelling images or videos to increase their Meta ad CTRs. It’s harder to get clicks on ads for industries where only some of the audience is going to be actively looking for these services. In this case, it’s best to focus on engaging ads and combining the right copy and creative with the right audience targeting strategy to maintain healthy CTRs.
For insights on how these metrics changed year over year, check out our full Meta Ads benchmarks breakdown over on WordStream!
🔏 Unlock more secrets to a higher click-through rate now!
Average cost per click
Cost per click, or CPC, tells you how much you’re paying for each click on your Facebook ad. It’s calculated by dividing your total spend by your total number of clicks. Maintaining a lower average CPC on a traffic campaign is something most businesses strive for since it proves you’re driving website visitors at an overall cheaper cost.
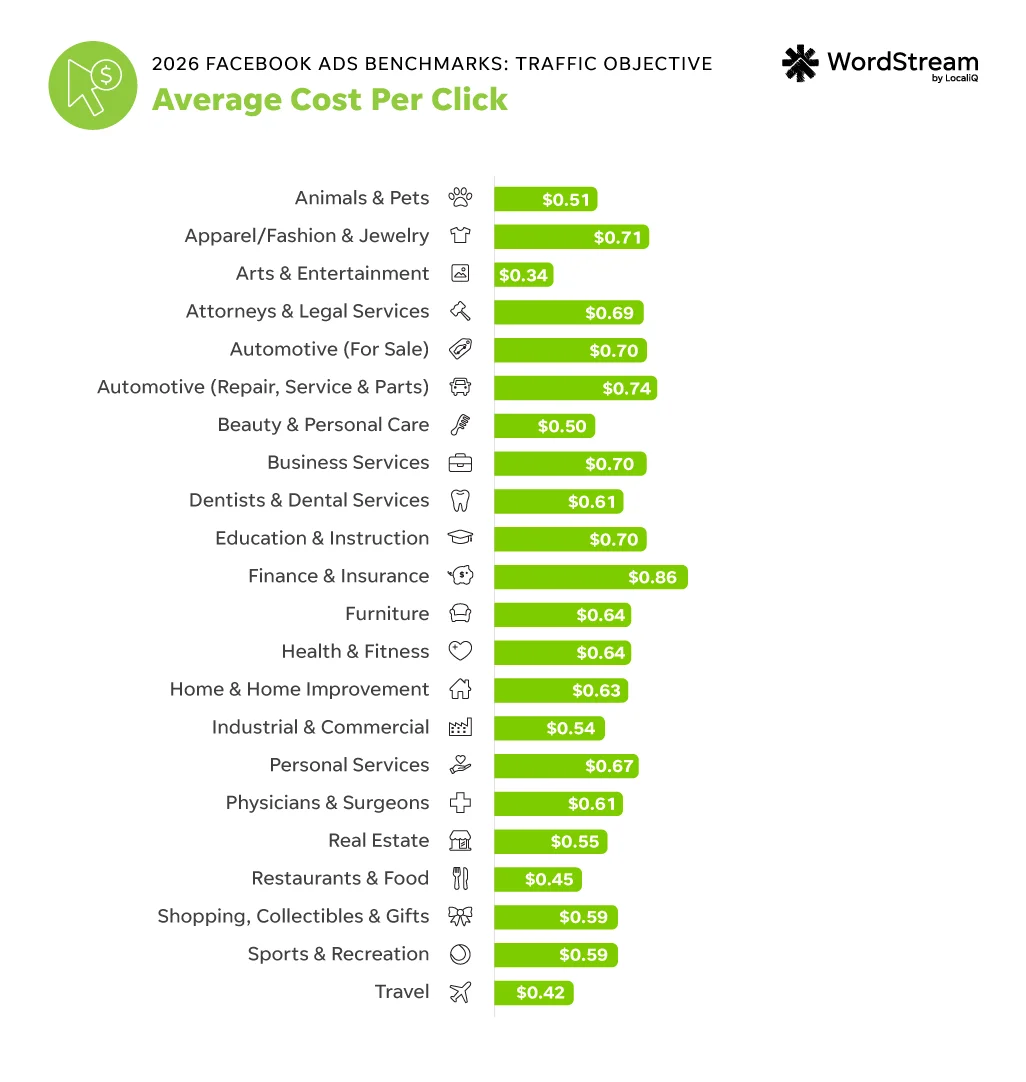
The average cost per click in Facebook ads for traffic campaigns across all industries is $0.60—down from last year’s average of $0.70.
| Business category | Average CPC |
| Animals & Pets | $0.51 |
| Apparel / Fashion & Jewelry | $0.71 |
| Arts & Entertainment | $0.34 |
| Attorneys & Legal Services | $0.69 |
| Automotive–For Sale | $0.70 |
| Automotive–Repair, Service & Parts | $0.74 |
| Beauty & Personal Care | $0.50 |
| Business Services | $0.70 |
| Dentists & Dental Services | $0.61 |
| Education & Instruction | $0.70 |
| Finance & Insurance | $0.86 |
| Furniture | $0.64 |
| Health & Fitness | $0.64 |
| Home & Home Improvement | $0.63 |
| Industrial & Commercial | $0.54 |
| Personal Services | $0.67 |
| Physicians & Surgeons | $0.61 |
| Real Estate | $0.55 |
| Restaurants & Food | $0.45 |
| Shopping, Collectibles & Gifts | $0.59 |
| Sports & Recreation | $0.59 |
| Travel | $0.42 |
The industries that saw the lowest cost per click were Arts & Entertainment at $0.34, Travel at $0.42, and Restaurants & Food at $0.45.
The industries that saw higher-than-average costs per click were Finance & Insurance at $0.86, Automotive—Repair, Service, & Parts at $0.74, and Apparel, Fashion, & Jewelry at $0.71. These industries typically have a higher lifetime average customer cost, so it makes sense that their advertising costs would be more than those of a restaurant or entertainment venue.
Facebook ads benchmarks: Leads campaigns
Facebook ad campaigns using the leads objective are optimized to drive leads. This can be done through actions such as form fills, messages, calls, and conversions.
Leads objective campaigns use Facebook Lead Ads. The unique format of Facebook Lead Ads includes a prompt directly within the ad to collect a lead. That way, users can provide your business with their information without having to navigate away from the Facebook platform.
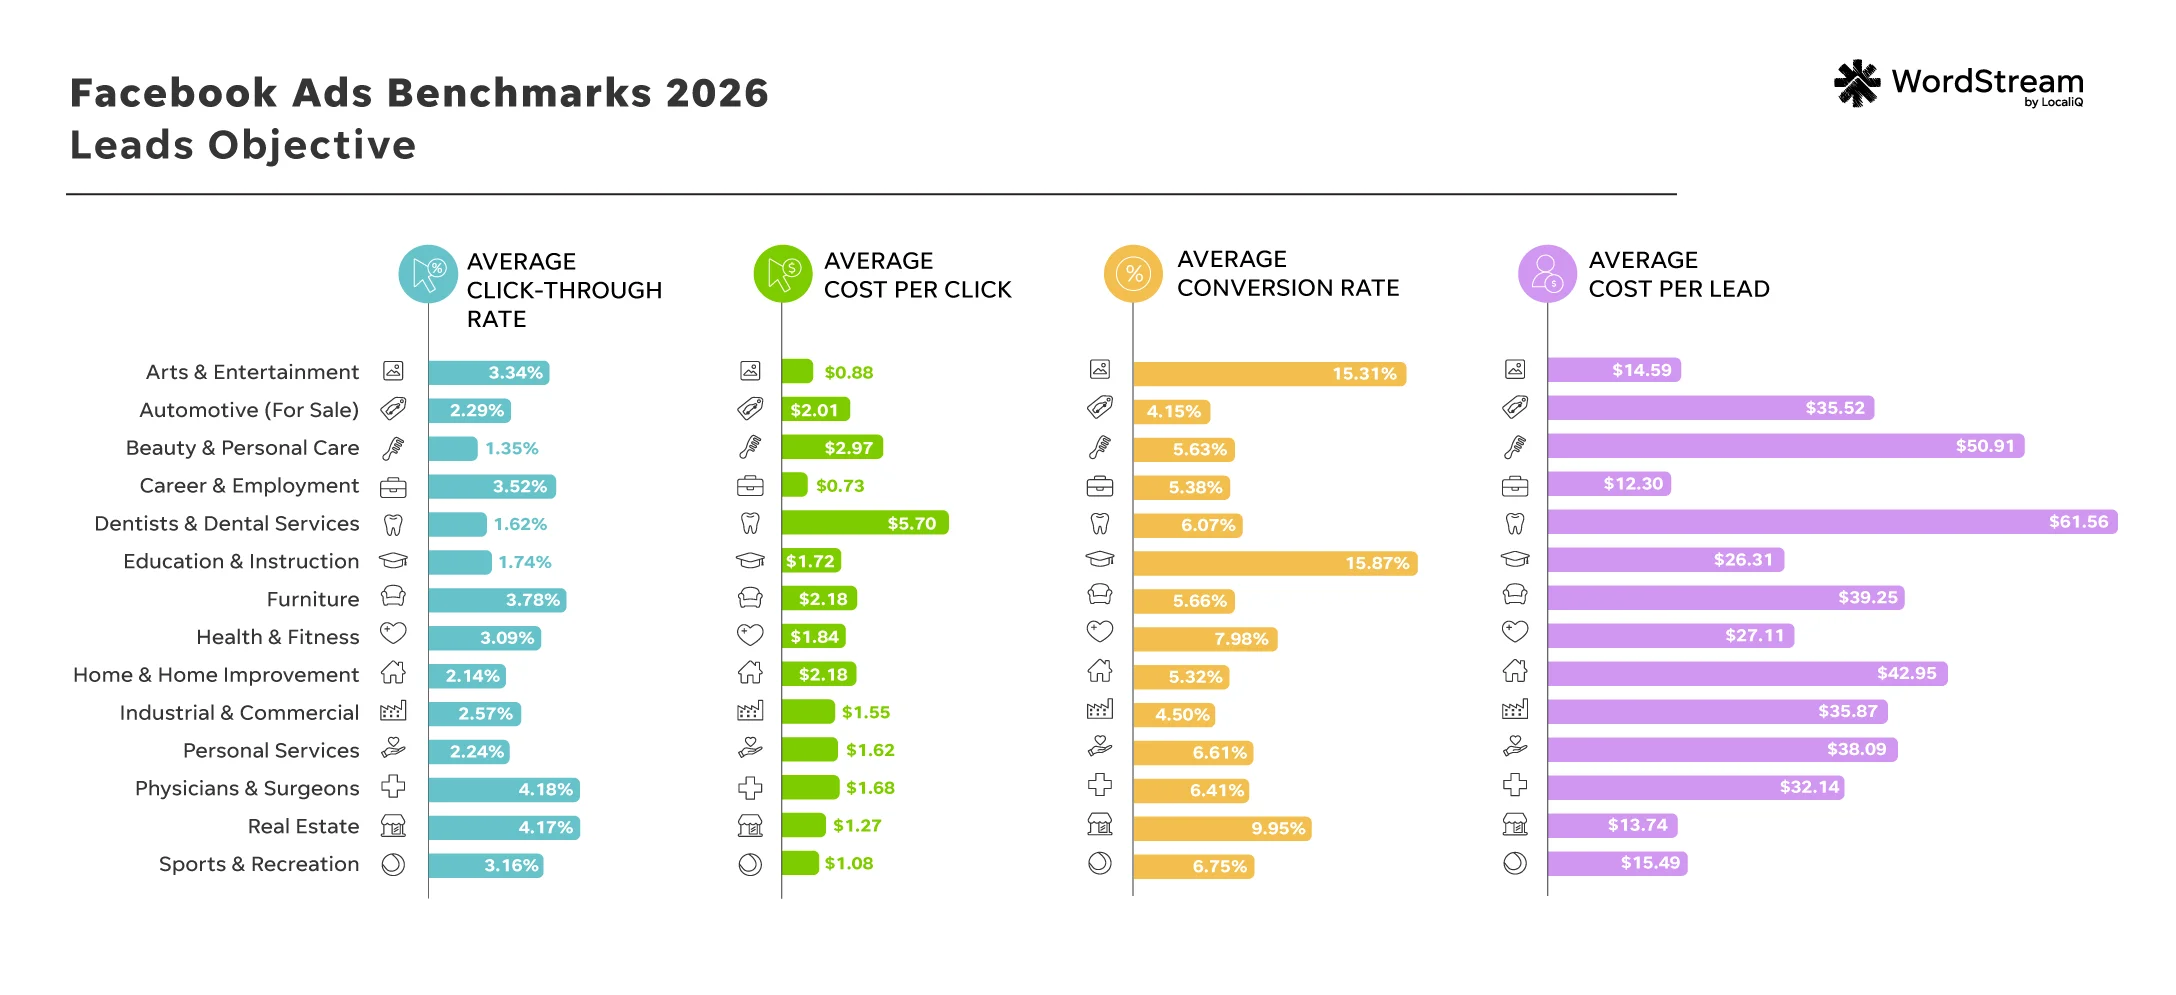
We added conversion rate and cost per lead to these benchmarks because this objective is primarily used for increasing leads and conversions.
Average click-through rate
While Facebook lead ads don’t necessarily require users to click to your business’s website, they still have to click on your ad to become a lead. The option to click on your website is still included in the ad. Prioritizing a higher click-through rate for your Facebook lead ads is key to attracting users to take action with your business.
The average click-through rate in Facebook ads for lead campaigns across all industries is 2.70%, which is an improvement over last year’s overall average of 2.59%.
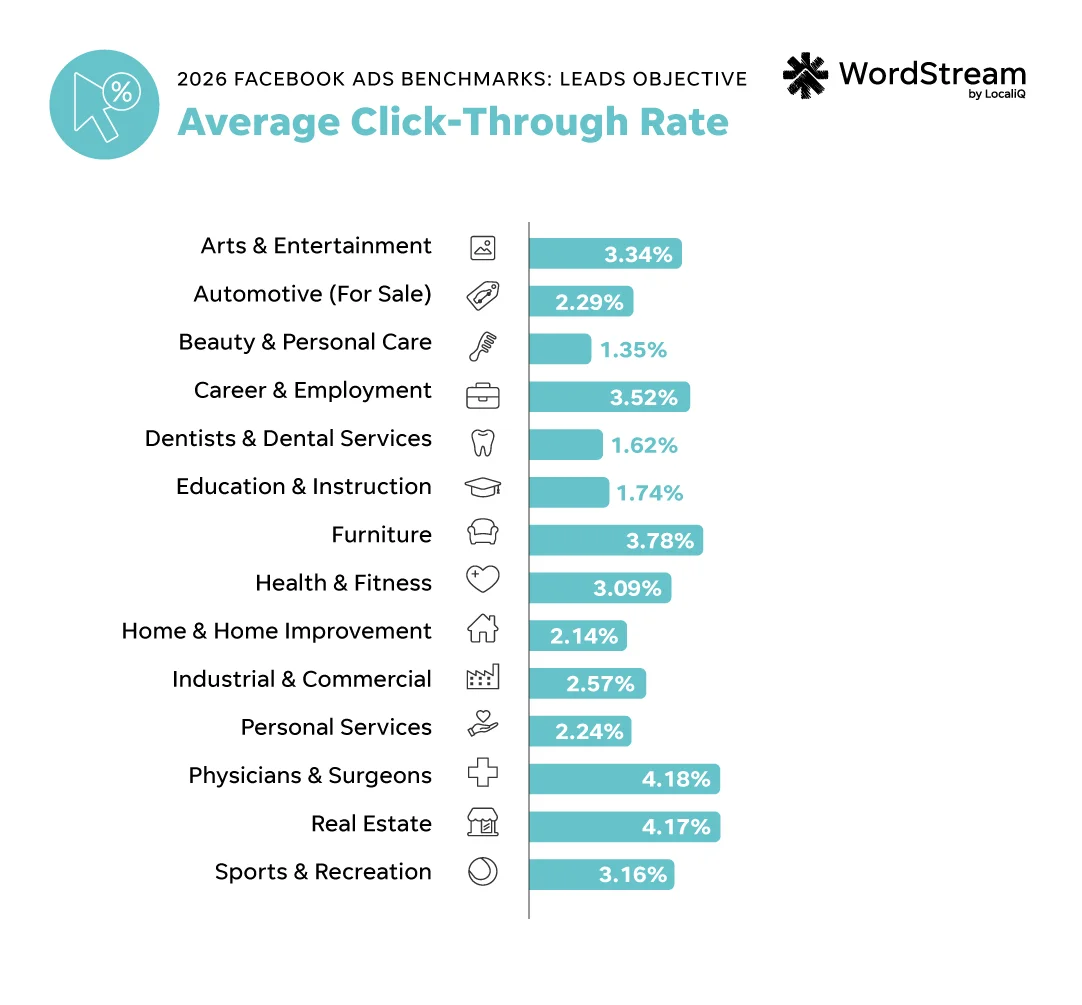
| Business Category | Average CTR |
| Arts & Entertainment | 3.34% |
| Automotive–For Sale | 2.29% |
| Beauty & Personal Care | 1.35% |
| Career & Employment | 3.52% |
| Dentists & Dental Services | 1.62% |
| Education & Instruction | 1.74% |
| Furniture | 3.78% |
| Health & Fitness | 3.09% |
| Home & Home Improvement | 2.14% |
| Industrial & Commercial | 2.57% |
| Personal Services | 2.24% |
| Physicians & Surgeons | 4.18% |
| Real Estate | 4.17% |
| Sports & Recreation | 3.16% |
The industries that saw the best CTRs on their Facebook ads running with the leads objective were Physicians & Surgeons at 4.18%, Real Estate at 4.17%, and Furniture at 3.78%.
The industries with the lowest CTRs were Beauty & Personal Care at 1.35%, Dentists & Dental Services at 1.62%, and Education & Instruction at 1.74%.
Average cost per click
Each click from your Facebook lead ads costs you money, so trying to maintain the lowest average CPC possible is a no-brainer. However, you’ll also want to factor in your lead quality when looking at your CPC. You ultimately want to turn your leads into customers, so a higher-quality lead may end up being worth a higher CPC.
The average cost per click in Facebook ads for the leads campaign objective across all industries is $1.80—a 6.25% decrease from last year’s average of $1.92.
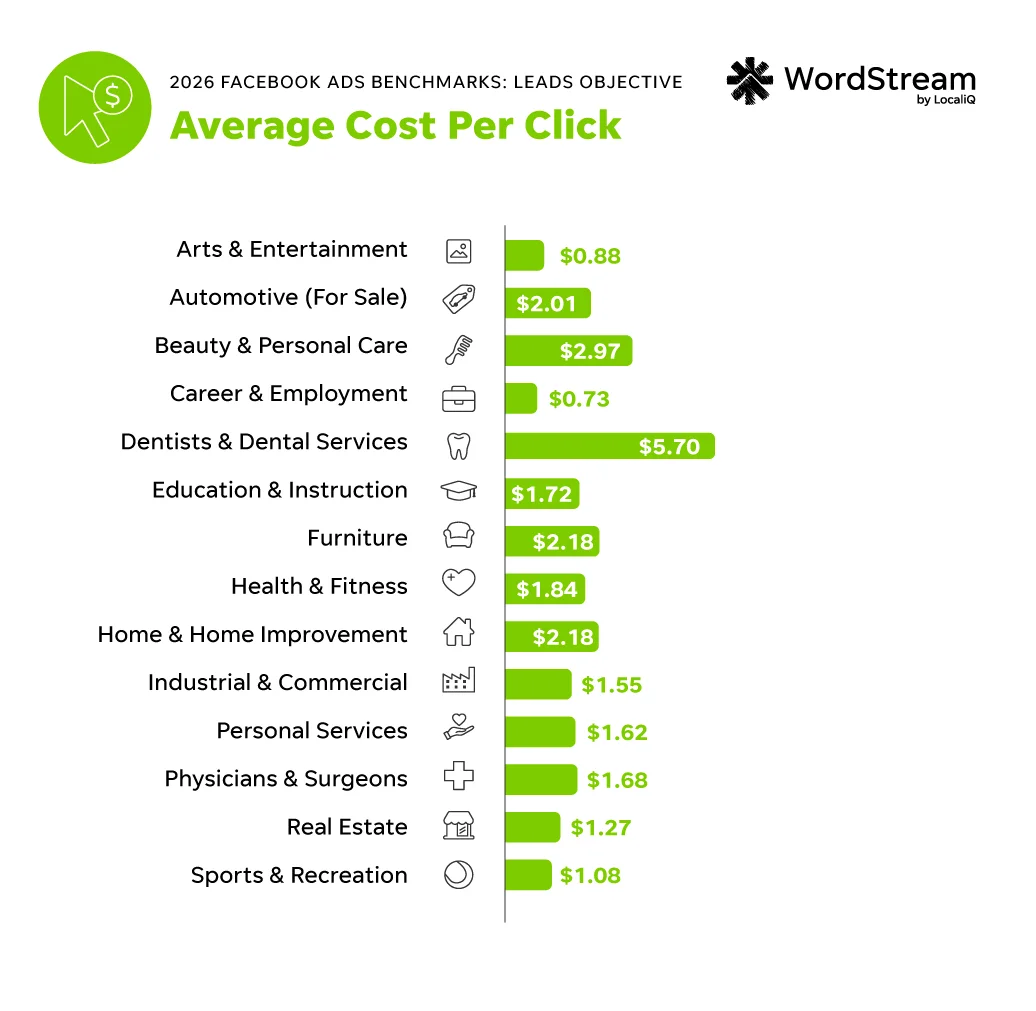
| Business Category | Average CPC |
| Arts & Entertainment | $0.88 |
| Automotive–For Sale | $2.01 |
| Beauty & Personal Care | $2.97 |
| Career & Employment | $0.73 |
| Dentists & Dental Services | $5.70 |
| Education & Instruction | $1.72 |
| Furniture | $2.18 |
| Health & Fitness | $1.84 |
| Home & Home Improvement | $2.18 |
| Industrial & Commercial | $1.55 |
| Personal Services | $1.62 |
| Physicians & Surgeons | $1.68 |
| Real Estate | $1.27 |
| Sports & Recreation | $1.08 |
The industries with the lowest CPCs were Dentists & Dental Services at $5.70, Beauty & Personal Care at $2.97, and Furniture as well as Home & Home Improvement at $2.18.
The industries that saw the highest CPCs for the leads objective were Career & Employment at $0.73, Arts & Entertainment at $0.88, and Sports & Recreation at $1.08.
When you compare average CTR and CPCs between the two objectives, you’ll find that CTR for lead gen campaigns is trending higher than that of the traffic objective. This may indicate that, while costs for lead gen clicks are higher, Facebook is likely targeting users that are actually a better fit for businesses (on average) than the traffic objective.
Average conversion rate
Conversion rate indicates how frequently your Facebook ads are turning clicks into leads. You can find out your conversion rate by dividing your total number of leads by your total number of clicks. Of course, a high conversion rate signals that your Facebook ad is compelling enough to convince potential customers to take the next step and become a lead with your business. If you find you have a lower conversion rate on average, you may need to rethink your ad targeting, copy, or landing page.
The average conversion rate in Facebook ads for lead campaigns across industries is 8.54%, which is higher than last year’s average of 7.72%.
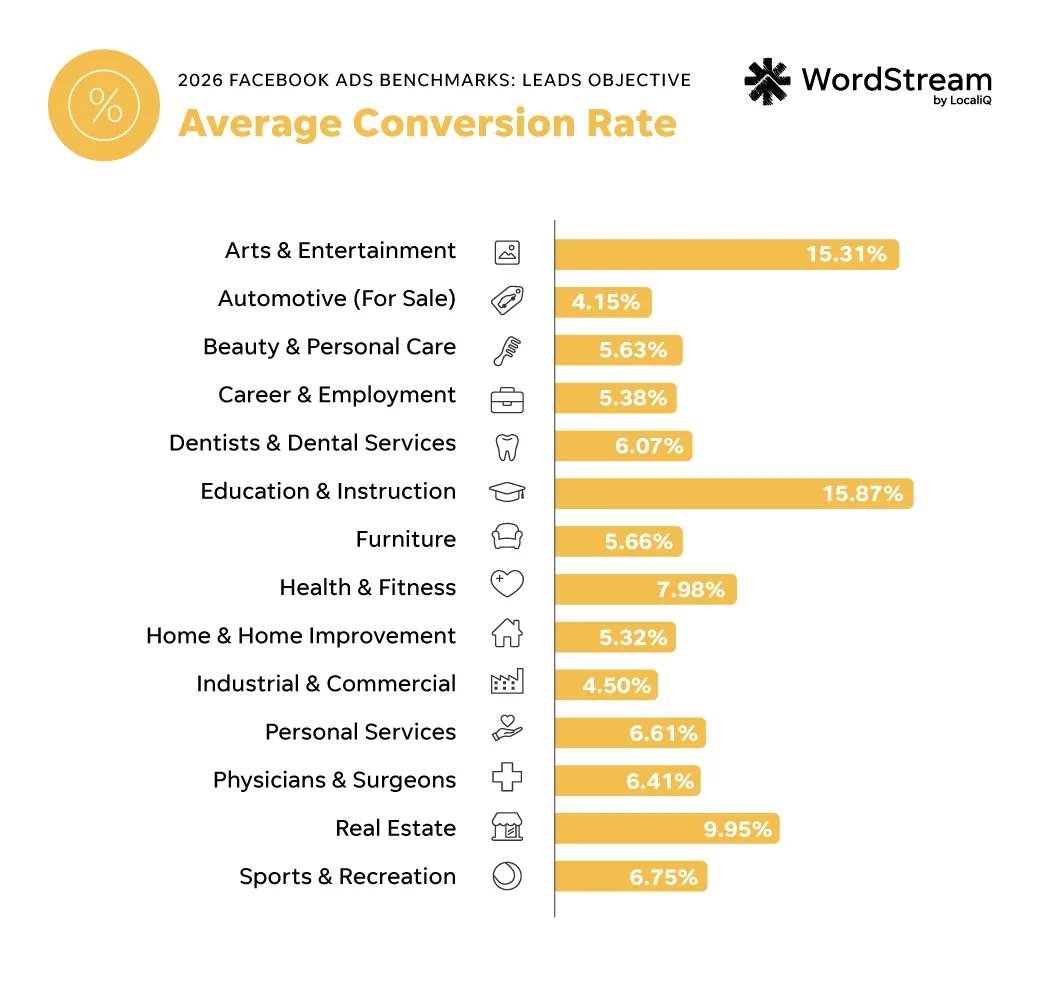
| Business Category | Average CVR |
| Arts & Entertainment | 15.31% |
| Automotive–For Sale | 4.15% |
| Beauty & Personal Care | 5.63% |
| Career & Employment | 5.38% |
| Dentists & Dental Services | 6.07% |
| Education & Instruction | 15.87% |
| Furniture | 5.66% |
| Health & Fitness | 7.98% |
| Home & Home Improvement | 5.32% |
| Industrial & Commercial | 4.50% |
| Personal Services | 6.61% |
| Physicians & Surgeons | 6.41% |
| Real Estate | 9.95% |
| Sports & Recreation | 6.75% |
The industries with the highest CVRs for Facebook ads running the leads objective were Education & Instruction at 15.87%, Arts & Entertainment at 15.31%, and Health & Fitness at 7.98%.
The industries that saw lower-than-average conversion rates were Automotive—For Sale at 4.15%, Industrial & Commercial at 4.50%, and Home & Home Improvement at 5.32%.
Facebook ads conversion rates are heavily reliant on your ad quality. Taking a bit more time to effectively map out your messaging and creative can make all the difference in your conversion rates.
Average cost per lead
Similar to clicks, securing a new lead from Facebook ads also costs your business money—which is known as your cost per lead. Cost per lead is calculated by dividing your total spend by your total number of conversions.
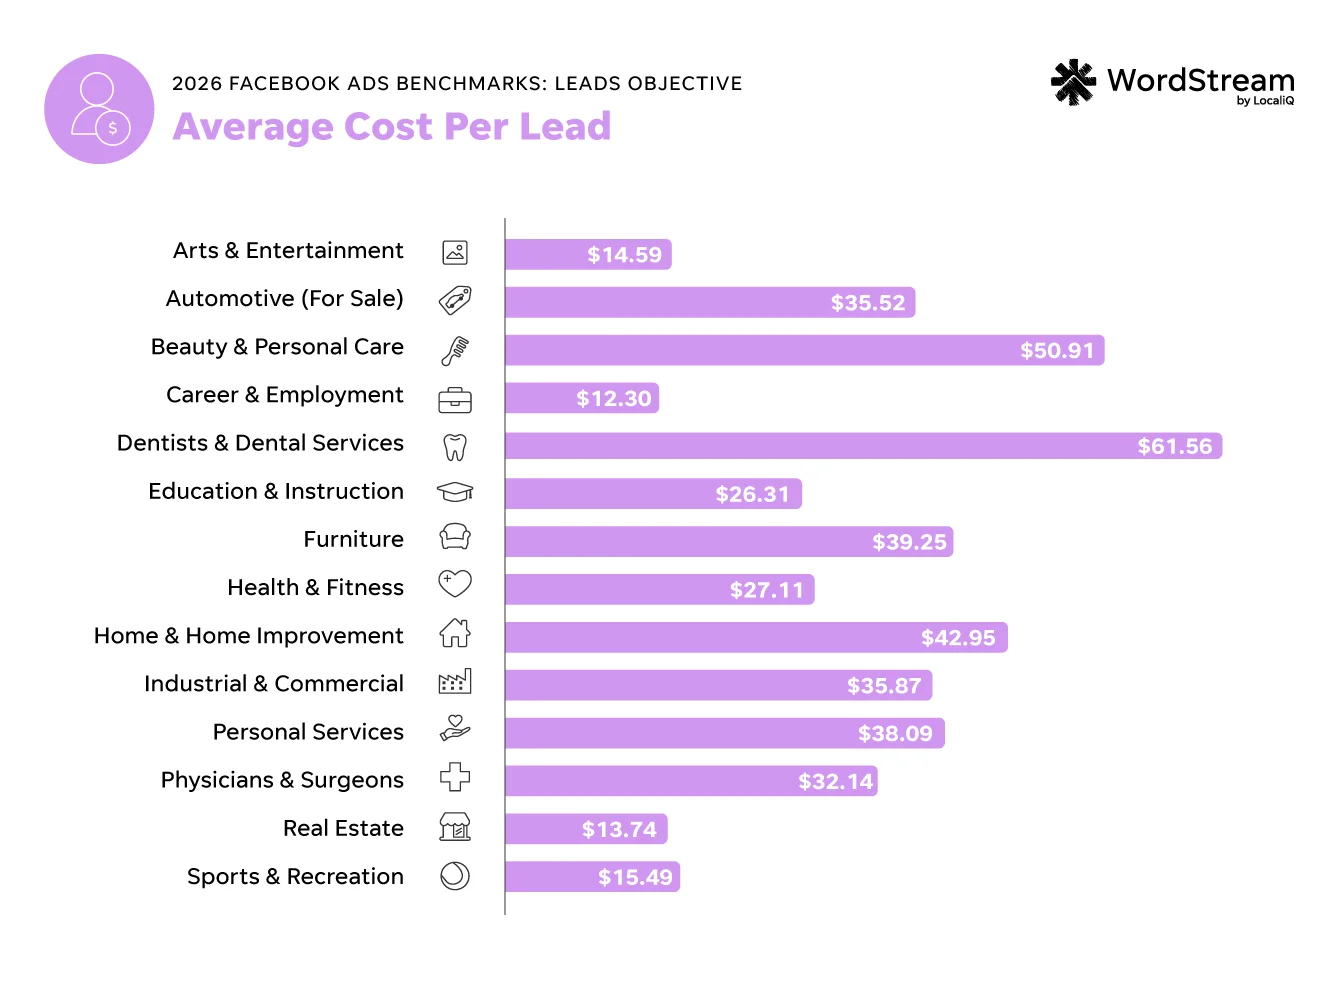
The average cost per lead in Facebook ads for the leads objective across industries is $27.39—a slight decrease from last year’s average of $27.66.
| Business Category | Average CPL |
| Arts & Entertainment | $14.59 |
| Automotive–For Sale | $35.52 |
| Beauty & Personal Care | $50.91 |
| Career & Employment | $12.30 |
| Dentists & Dental Services | $61.56 |
| Education & Instruction | $26.31 |
| Furniture | $39.25 |
| Health & Fitness | $27.11 |
| Home & Home Improvement | $42.95 |
| Industrial & Commercial | $35.87 |
| Personal Services | $38.09 |
| Physicians & Surgeons | $32.14 |
| Real Estate | $13.74 |
| Sports & Recreation | $15.49 |
The industries with the lowest Facebook ads lead campaign costs per lead were Career & Employment at $12.30, Real Estate at $13.74, and Arts & Entertainment at $14.59.
The industries with the highest cost per lead for Facebook ads lead campaigns were Dental Services at $61.56, Beauty & Personal Care at $50.91, and Home & Home Improvement at $42.95.
6 Facebook ads tips
If your Facebook ads are not converting or driving traffic as much as they should when compared to industry averages, you’re not alone. There’s always room to improve—especially by following these Facebook ads tips and best practices that can enhance your performance:
1. A/B test CTA buttons
A powerful call to action can entice users to click on your Facebook ad—increasing your click-through rate. Luckily, Facebook gives you plenty of options to play around with when it comes to choosing an effective CTA button for your ad. Your best bet is to A/B test a few different CTA buttons to see what works.

Mat Wendler, Senior Manager of Optimization Strategy & Custom Solutions at LocaliQ, says A/B testing is one of the most valuable things you can do to improve your campaigns.
“It allows you to compare variations of creative, imagery, headlines, or messaging and make data-driven decisions based on performance. Consistent testing and optimization are often the key to improving results over time and maximizing your return on ad spend,” Mat said.
2. Perfect your lead ad form fields
You may need to test to see which form style works best to maximize both lead quality and quantity. For example, you can use conditional logic in the Facebook lead form setup. Leveraging conditional logic in your forms can help you pre-qualify your leads.

An example of conditional logic settings within a Facebook Lead Ad.
3. Pay attention to the right metrics
Beyond what was covered in this report, there are tons of other social media metrics that can indicate Facebook advertising success for your business. Find a measurement and reporting method tailored to your needs and stick with it. For example, metrics like CTR may not always be the “end-all, be-all” Facebook ads KPI for your business.
“The most important metric is the one that aligns with the campaign goal,” said Kendall Cagle, Product Manager for Social & Display Media at LocaliQ. “For a traffic campaign, I would prioritize qualified website visits and CPC, with CTR as a signal of relevance. For a lead campaign, CPL is the clearest efficiency measure, but I would always pair it with CVR and lead quality so we are not optimizing for inexpensive leads that do not create business value.”
Mat agrees. “No single metric tells the full story,” he said. “The best way to evaluate performance is to look at how those metrics work together and tie them back to the campaign objective.”
4. Get strategic with your audience
You may want to target different Facebook audiences for different objectives. For example, you may target a Facebook lookalike audience with a traffic objective, so you can educate a new crop of potential customers about who you are and what you do.
Alternatively, you may target a specific email list or retarget users while using the lead gen objective. That’s because these audiences are already aware of your business and may be more likely to convert.
On the other hand, you may go for a more general, broader audience based on Facebook’s behavior and interest targeting options. A larger reach has been found to lower your overall cost per thousand impressions (CPM), since you’re casting a wider net.
Facebook ads audience size indicator on the right-hand side of your screen during the ad set buildout level can help you know if your target market size is just right.
On the other hand, you may want to try using a Meta Advantage+ audience to expand your reach. Advantage+ is a suite of AI-powered features you can use for audience targeting, ad creation, and more. Just note that using Advantage+ can sway your Facebook ads results if you’re not 100% confident in the data you feed it to help guide and optimize your audience lists.
“You will likely see better metrics in your Meta advertising reports with Advantage+, but who are you actually advertising to? My suggestion is to either use Advantage+ sparingly or have quality control in place to limit the number of bots that submit forms,” said Brett McHale, founder of Empiric Marketing.
For instance, you might block specific email domains or phone numbers on your forms to limit lead spam. That way, your lead quality stays high when implementing Advantage+ targeting.

🚨 Incorporating AI into your advertising strategy can be a challenge. Find out how to do it right with these 9 powerful ways to use AI in Facebook and Google Ads!
5. Evaluate all your campaign objective options
If you have experience with search ads, you can think of your Facebook campaign objectives like how you would your Google or Microsoft campaign goals and bidding strategies. Campaign objectives impact how Facebook serves your ads, so you may want to test out a few. That way, you can see which ones serve your ads the most efficiently. In short, don’t be married to one campaign objective.
One of the best perks Facebook offers to advertisers is that there are tons of campaign objectives to choose from. Keep an open mind for all the potential campaign objectives you may want to try.
Here’s a breakdown of the Facebook ads campaign objectives you can choose from:
- Leads
- Traffic
- Awareness
- Engagement
- App promotion
- Sales

6. Incorporate other channels into your strategy
Your Facebook ads should play a role in a larger marketing plan that rounds out your business’s advertising strategy. To start, be sure to regularly share organic posts to Facebook to fill any gaps in your paid Facebook ad performance.
You’ll likely want to also leverage other social media platforms, as well as channels like SEO and search ads, to supplement your Facebook Ads.
For example, your audience members are probably using TikTok and Snapchat in addition to Facebook or Instagram. You could promote your business across these platforms to grow your overall social presence. Many marketing channels provide similar benefits to businesses, so it’s best to use as many as possible in tandem for a holistic marketing approach.
A cross-channel marketing approach that includes social and search ads, as well as other channels, helps you reach your audience regardless of where they are online. However, juggling all those channels can be a challenge. Luckily, there are plenty of tools and solutions available that can help you manage your campaigns across channels.
What these Facebook ads benchmarks mean for your business
You can gauge how your business compares to the competition in your industry by tracking your Facebook ads performance against these industry benchmarks. This can be especially helpful when you don’t have a ton of data or you’re unsure of how to best measure your Meta Ads marketing ROI.
Keep in mind, though, that every business is unique. No two Facebook ad accounts are the same. So, be sure to align your advertising expectations with what’s achievable for your business. That said, if you tried our suggested tips above and still find your business’s performance isn’t up to the industry standards outlined here, that’s okay! See how our solutions can help you improve your Facebook ads strategy.

Recommended for you





Unlock your business potential
We offer innovative technology and unparalleled expertise to move your business forward.